Lesson 1.4 — Ratio Tables & Double Number Lines
Two tools that organize equivalent ratios so you can find missing values and compare.
🎙️ Narration script
Hey, welcome back! Today we're picking up two really handy tools: ratio tables and double number lines. Both of them help you organize equivalent ratios so you can find missing values and compare.
Let's start with the ratio table. It's just a table with two rows, and the trick is that both rows stay in the same ratio in every single column. Take pancakes. One cup of mix makes four pancakes. So in the first column, we have one and four. Two cups? Eight pancakes. Three cups? Twelve. Four cups? Sixteen. Notice every column is the same comparison, four pancakes for each cup.
How do you move from one column to the next? You multiply both rows by the same number. That number is called the scaling factor. As long as you multiply both quantities by it, the ratio stays equivalent.
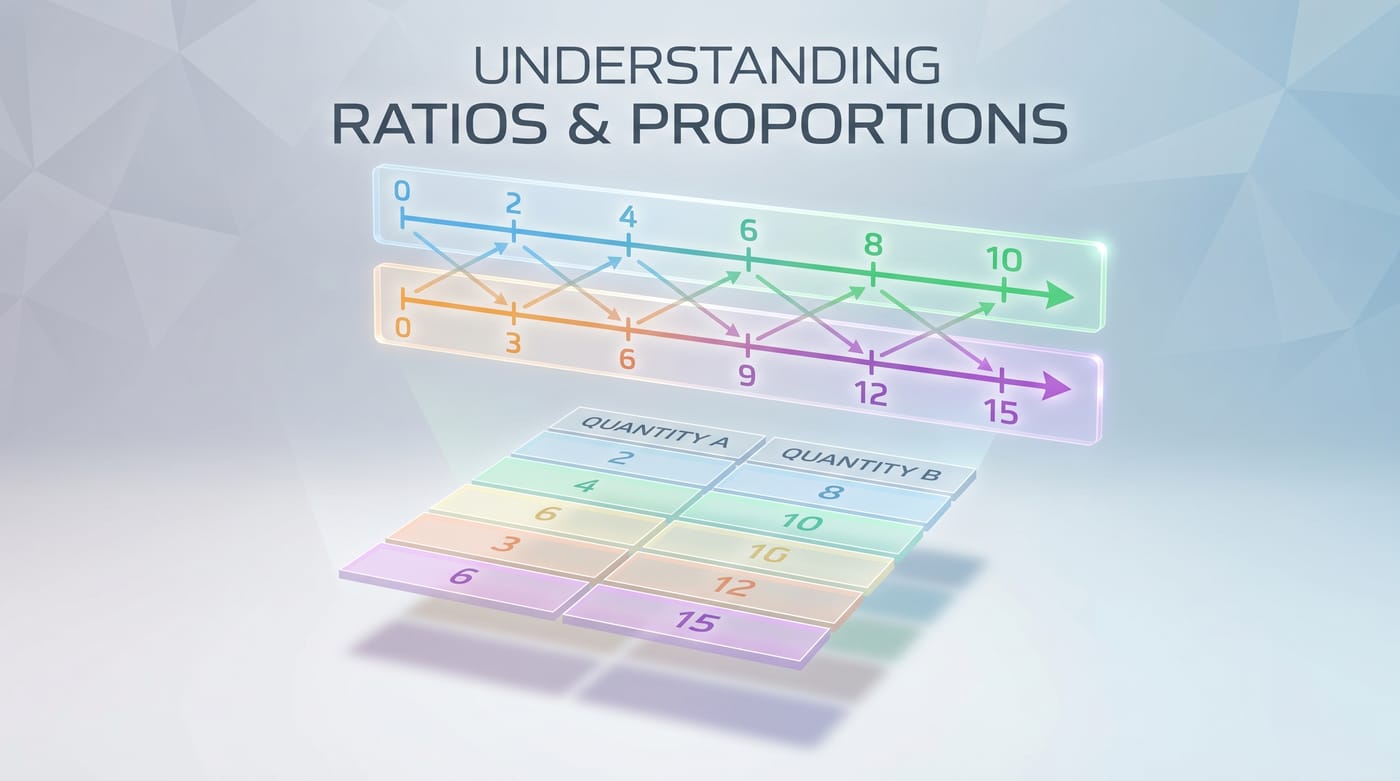
Now the double number line. This is the same information, just drawn out. You have two number lines stacked and lined up. The top might show cups, one, two, three, four. The bottom shows pancakes, four, eight, twelve, sixteen. Each step adds the same amount, which is just our unit rate again.
So which tool should you use? Honestly, whichever you like. The table is compact and quick for calculating. The number line shows the spacing so you can see it.
And here's how you fill in a missing value. Find the unit rate, the amount per one, then multiply up. Three apples cost a dollar fifty, so one apple is fifty cents, so seven apples are three dollars and fifty cents.
Quick recap. Ratio tables and double number lines both organize equivalent ratios. Move between columns by multiplying both quantities by the same number, and use the unit rate to find any missing value. Awesome work!
1 Core idea
A ratio table and a double number line are two ways to lay out the same family of equivalent ratios. They make it easy to scale up, scale down, and find a missing value — because every column (or tick) keeps the same ratio.
2 Key terms
- Ratio table
- A table whose two rows stay in the same ratio in every column.
- Equivalent ratios
- Columns made by multiplying or dividing both rows by the same number.
- Double number line
- Two aligned number lines that pair the quantities tick-by-tick.
- Scaling factor
- The number you multiply both quantities by to move between columns.
3 Real-life examples
- Pancakes: 1 cup of mix makes 4 pancakes → 2 cups → 8, 3 cups → 12.
- Recipe: 2 cups flour : 1 cup sugar → 4:2 → 6:3 (scale the whole recipe).
- Missing value: 3 apples cost $1.50, so 1 apple = $0.50 → 7 apples = $3.50.
Reveal the thinking
4 Common doubts
How is a ratio table different from a normal table?
In a ratio table, both rows scale together — every column is an equivalent ratio.
Ratio table or double number line — which do I use?
Same information. The table is compact for calculating; the number line shows the spacing visually.
How do I fill in a missing value?
Find the multiplier between two known columns, then multiply both rows by it — or use the unit rate (per 1) and multiply.
5 Step-by-step
- Put the two quantities as two rows.
- Find the multiplier from one column to the next (×2, ×3, …).
- Multiply both rows by it so the ratio stays equivalent.
- For any value, use the unit rate (per 1) and multiply up.
📊 See it · 4 pancakes per cup of mix
| Cups of mix | 1 | 2 | 3 | 4 |
|---|---|---|---|---|
| Pancakes | 4 | 8 | 12 | 16 |
Ratio table — each column is ×4 (the unit rate: 4 pancakes per cup).
Double number line — the same ratio, shown as equal steps.
- A ratio table shows 3 cups of flour → 12 cookies. How many cookies for 7 cups?
answer
Unit rate = 12 ÷ 3 = 4 cookies per cup, so 7 × 4 = 28 cookies. - On a double number line, 2 hours lines up with 90 miles. What lines up with 1 hour, and with 5 hours?
answer
Unit rate = 90 ÷ 2 = 45 miles per hour → 1 hour = 45 miles, and 5 × 45 = 225 miles.
Grounded in CA CCSS-M, Grade 6 · 6.RP.3a (ratio tables, double number line diagrams), California Department of Education. Hero image generated with Gemini Nano Banana Pro.