Lesson 6.2 — Mean, Median & Mode
Three different ways to find the "center" of a pile of numbers — and they don't always agree.
🎙️ Narration script
Welcome back! Today we're learning three different ways to find the center of a group of numbers: the mean, the median, and the mode. And here's the fun part, they don't always agree.
When you have a list of numbers, you often want just one number that describes the whole group. That's called a measure of center.
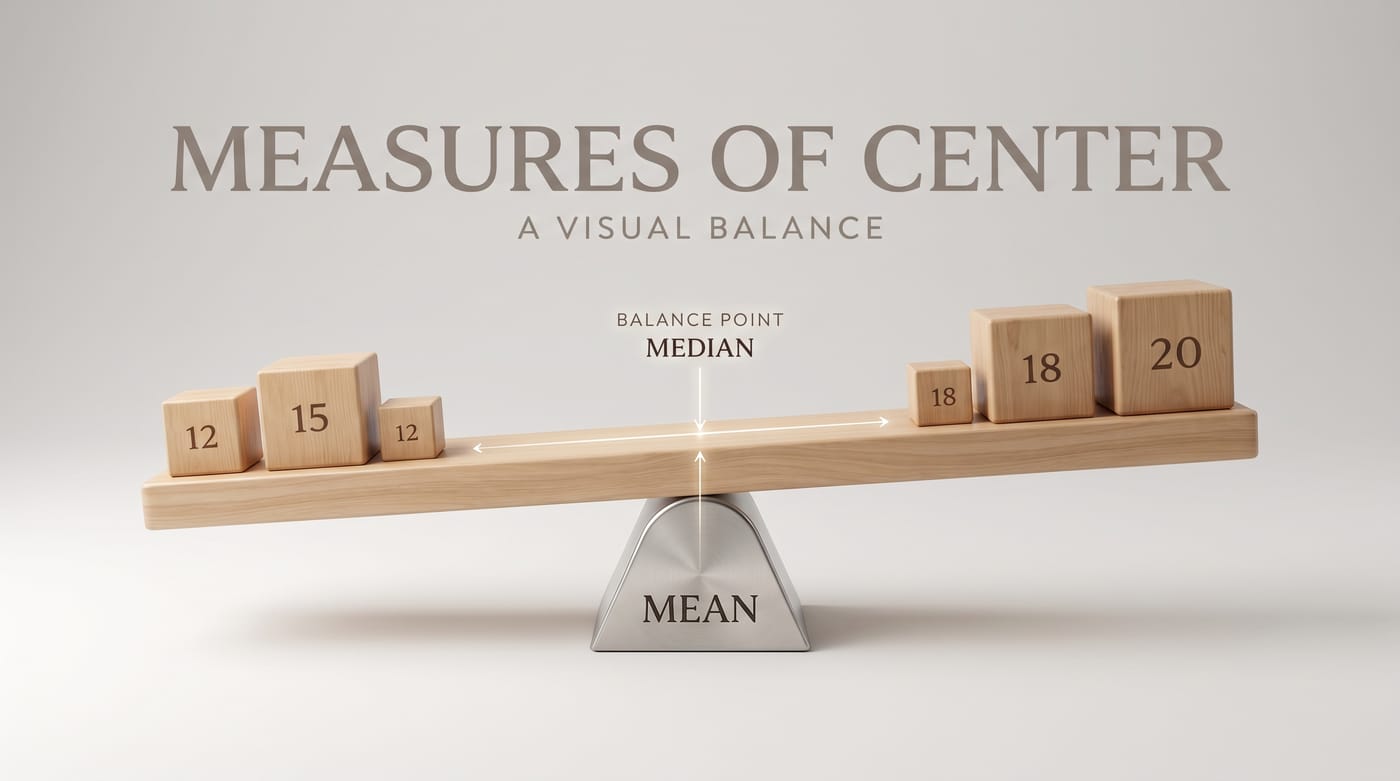
First, the mean. That's the average. You add up all the values, then divide by how many there are. Think of it as the balancing point of your data.
Next, the median. That's the middle value once you've put the numbers in order. And here's an important reminder: for the median, you have to sort first. If there's an even number of values, you take the two in the middle and average them.
Third, the mode. That's just the value that shows up most often. A set can have one mode, more than one, or sometimes none at all.
Let's work an example with the numbers three, five, five, seven, and ten. For the mean, add them up: three plus five plus five plus seven plus ten is thirty. Divide by five values, and you get six. For the median, they're already in order, and the middle one is five. For the mode, five appears twice, so the mode is five.
Now, why are the mean and median sometimes different? Because of outliers. An outlier is a value way out from the rest. It pulls the mean toward it, but it barely moves the median. That's why news reports use the median house price, so one giant mansion doesn't throw off the whole number.
Quick recap. Mean: add and divide. Median: the middle of the sorted list. Mode: the most frequent value. And watch out for those outliers!
1 Core idea
When you have a list of numbers, you often want one number that describes the whole group. That single number is a measure of center. There are three common ones: the mean (the balancing-point average), the median (the middle value when sorted), and the mode (the value that shows up most). They answer slightly different questions, so it helps to know all three.
2 Key terms
- Mean (average)
- Add all the values, then divide by how many there are.
- Median
- Put the values in order; the median is the middle one. With an even count, average the two middle values.
- Mode
- The value that appears most often. A set can have one mode, several, or none.
- Data set
- The whole collection of numbers you are studying.
- Outlier
- A value far away from the rest — it can pull the mean up or down a lot.
3 Real-life examples
- Test scores: your average grade is the mean of your scores.
- House prices: news reports use the median price so one giant mansion doesn't skew it.
- Shoe store: the most-sold size is the mode — that's what they restock most.
- Quiz set 3, 5, 5, 7, 10: mean = 6, median = 5, mode = 5.
Reveal the thinking
4 Common doubts
Do I sort the numbers before finding the mean?
No — for the mean, order doesn't matter; you just add and divide. Sorting only matters for the median.
What if two numbers tie for "most often"?
Then the set has two modes (it's "bimodal"). If every value appears the same number of times, there is no mode.
Why are mean and median sometimes different?
An outlier pulls the mean toward it but barely moves the median. That's why median is "fairer" for skewed data like prices or incomes.
How do I find the median of an even-sized list?
Sort it, find the two middle values, and take their mean. For 2, 4, 6, 8 → middle pair is 4 and 6 → median = 5.
5 Step-by-step (all three for 3, 5, 5, 7, 10)
- Mean: add them: 3 + 5 + 5 + 7 + 10 = 30. Divide by 5 values: 30 ÷ 5 = 6.
- Median: already sorted; 5 values, so the middle (3rd) one is 5.
- Mode: 5 appears twice, everything else once, so the mode is 5.
📊 See it · the mean is the balance point
Dot plot of 3, 5, 5, 7, 10. The triangle (▲) marks the mean = 6 — the spot where the dots would balance like weights on a seesaw.
Now the numbers:
- Find the median of 2, 4, 6, 8.
answer
Even count, so average the two middle values: (4 + 6) ÷ 2 = 5. - For 2, 3, 10, is the mean bigger or smaller than the median, and why?
answer
Mean = 15 ÷ 3 = 5; median = 3. The mean is bigger because the outlier 10 inflates the total and pulls the average up, while the median stays anchored at the middle value.
Grounded in CA CCSS-M, Grade 6 · 6.SP (summarizing data with measures of center), California Department of Education. Hero image generated with Gemini Nano Banana Pro.